
There's a major new feature that slipped through the announcements a few weeks back (frankly, because we had too much news that week), and that is Code Canvases in Fire, Water, and Earth.
Normally, when your debug session breaks – be it on an Exception, a breakpoint, or because you manually hit Pause, you expect to see something like this:
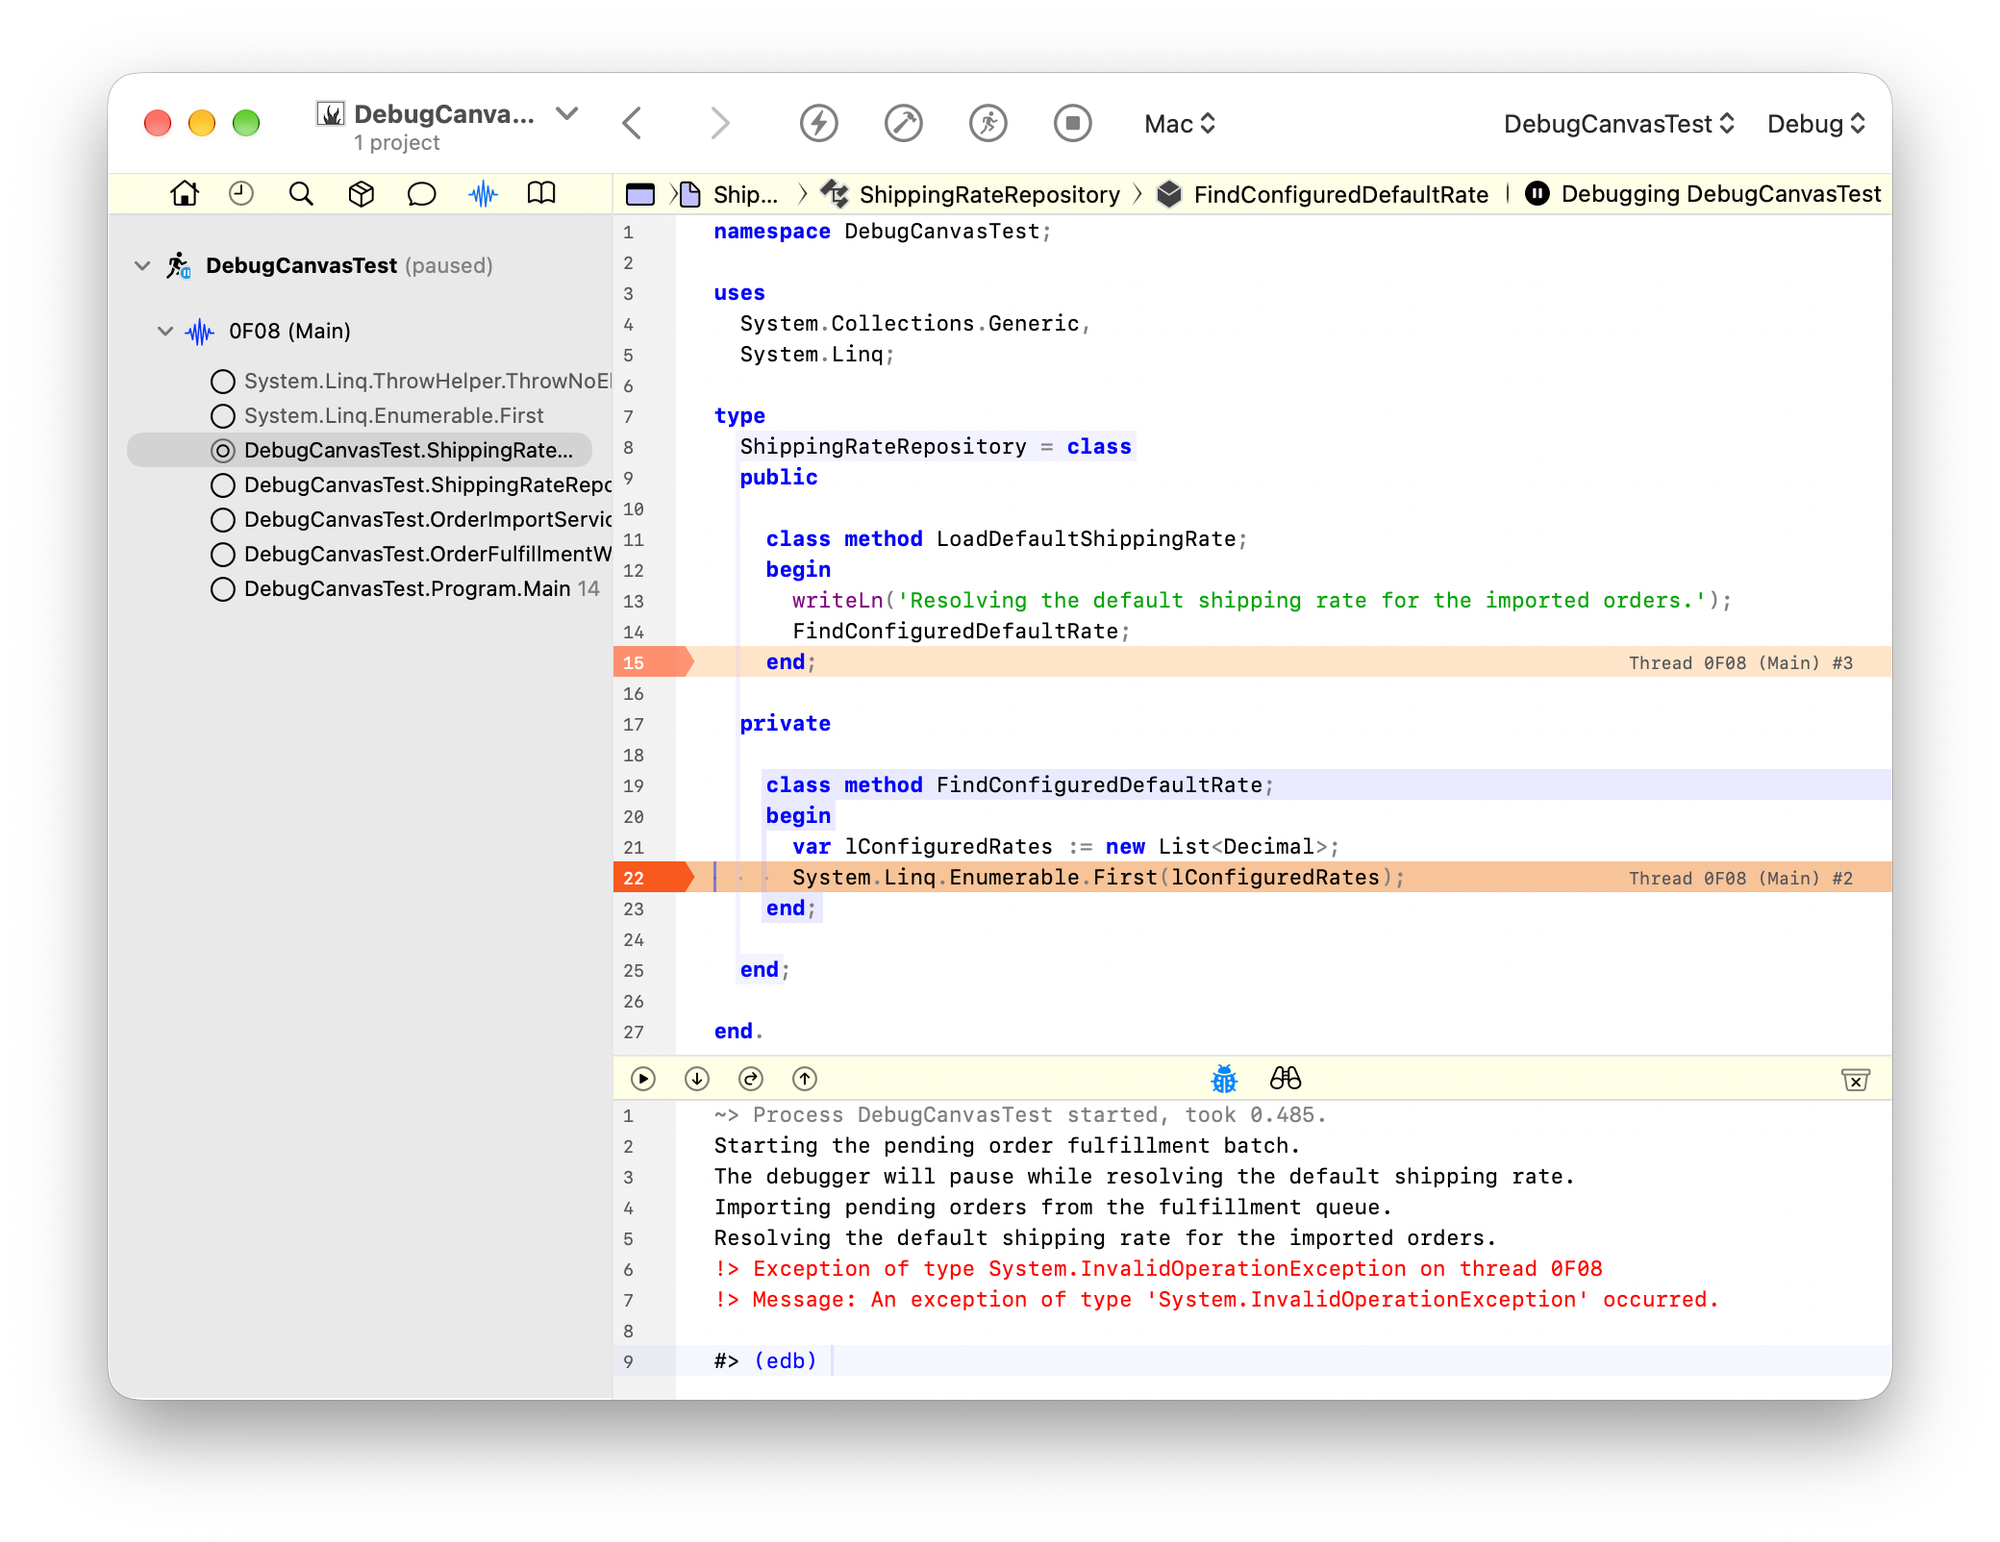
Depending on your IDE settings, it might be closer or farther away from where the real error is, in the Exception case; last year, we introduced some granularity here:
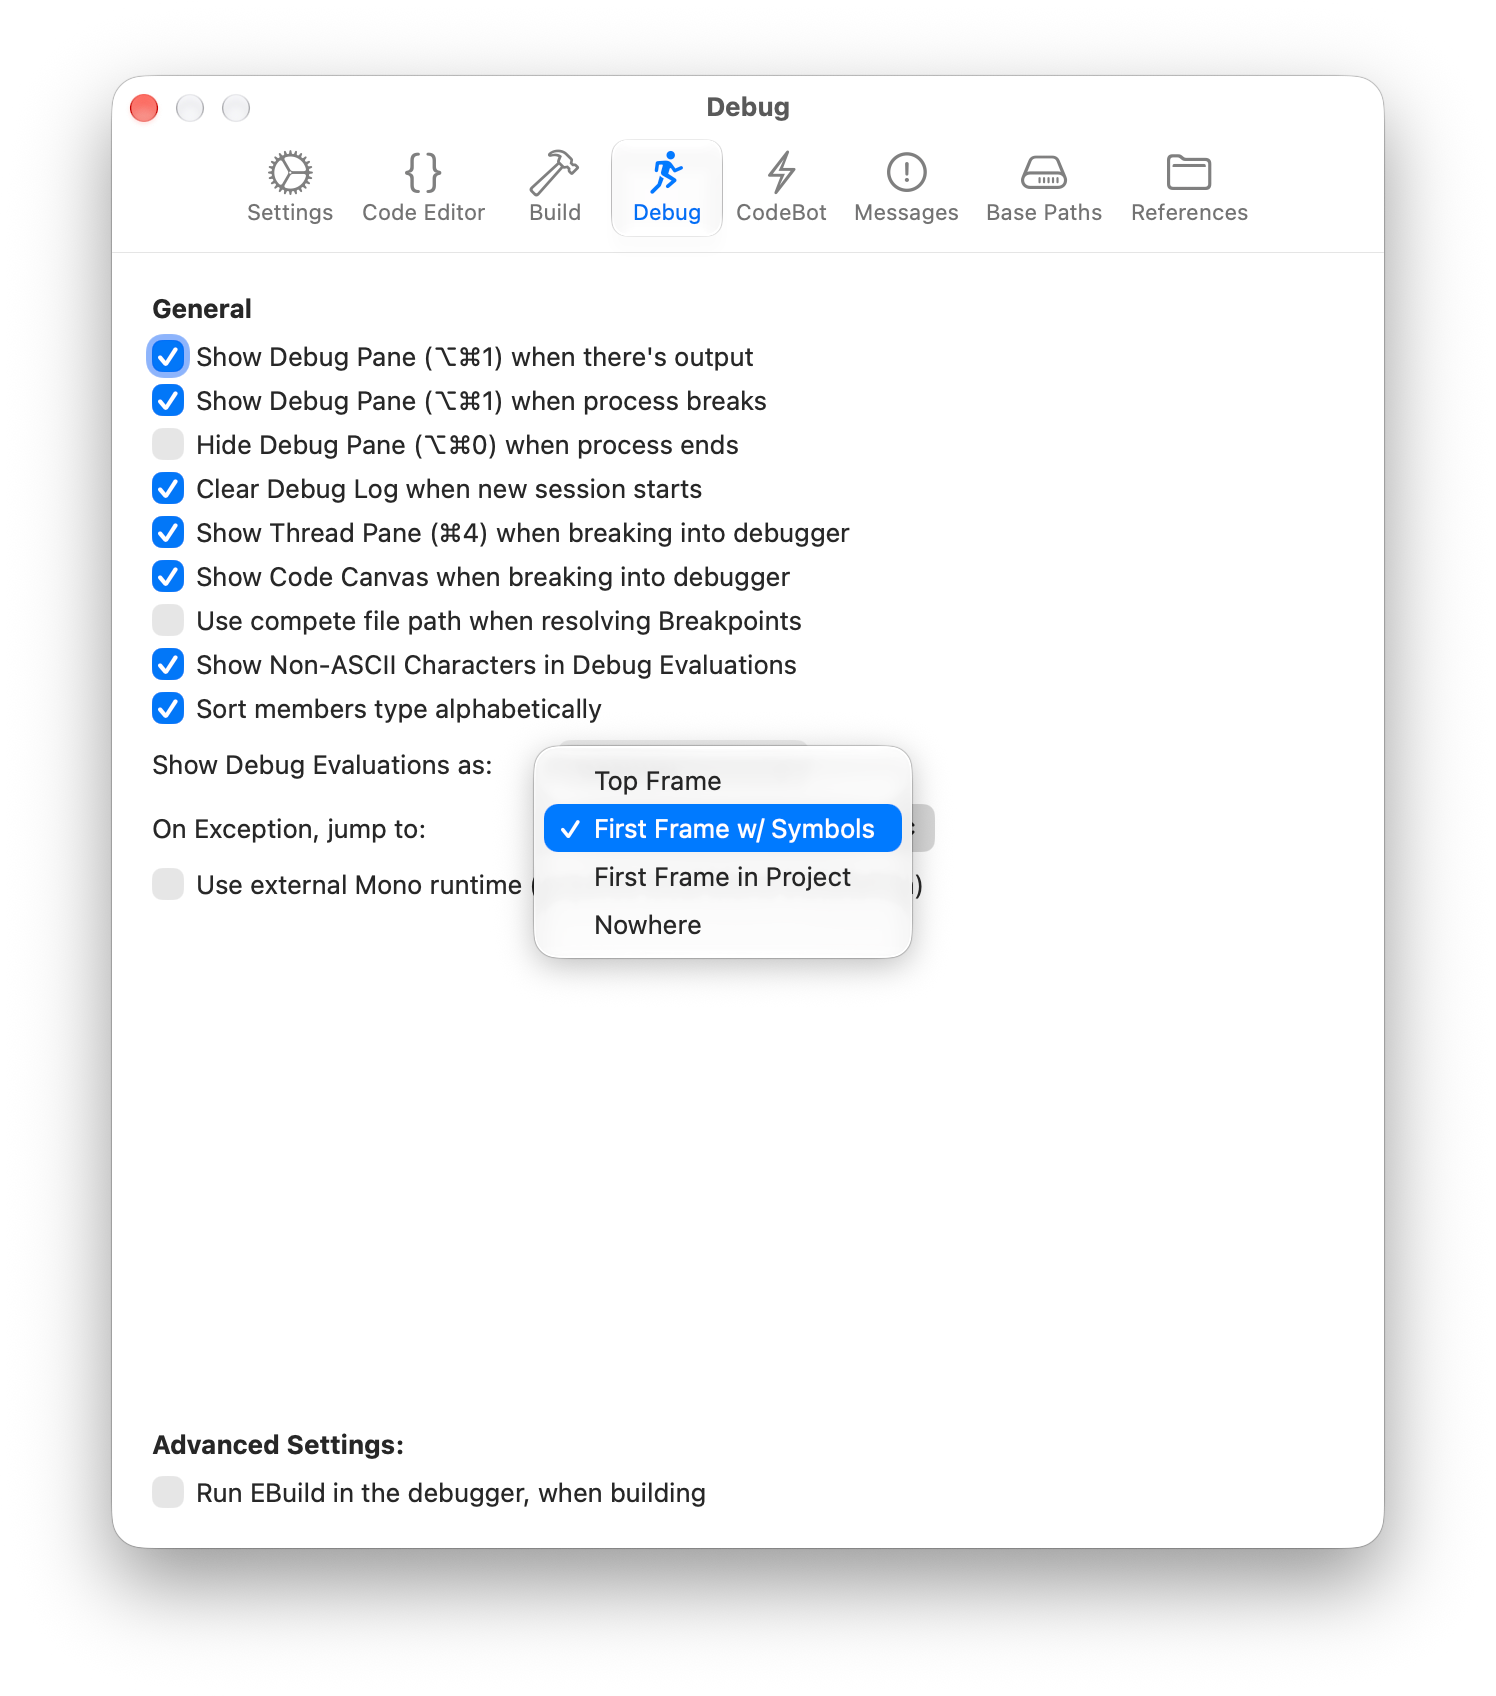
But with Debug Canvas, we're taking it to the next level.
The fundamental problem is that, no matter which stack frame the debugger shows, you're only seeing a small part of the picture. You might see the raise (or throw), but not the line that has the actual bad input. You might now see either.
In Fire, Water, and Earth, when your project breaks into the debugger, you will – from now on, by default – see the new Debug Canvas:
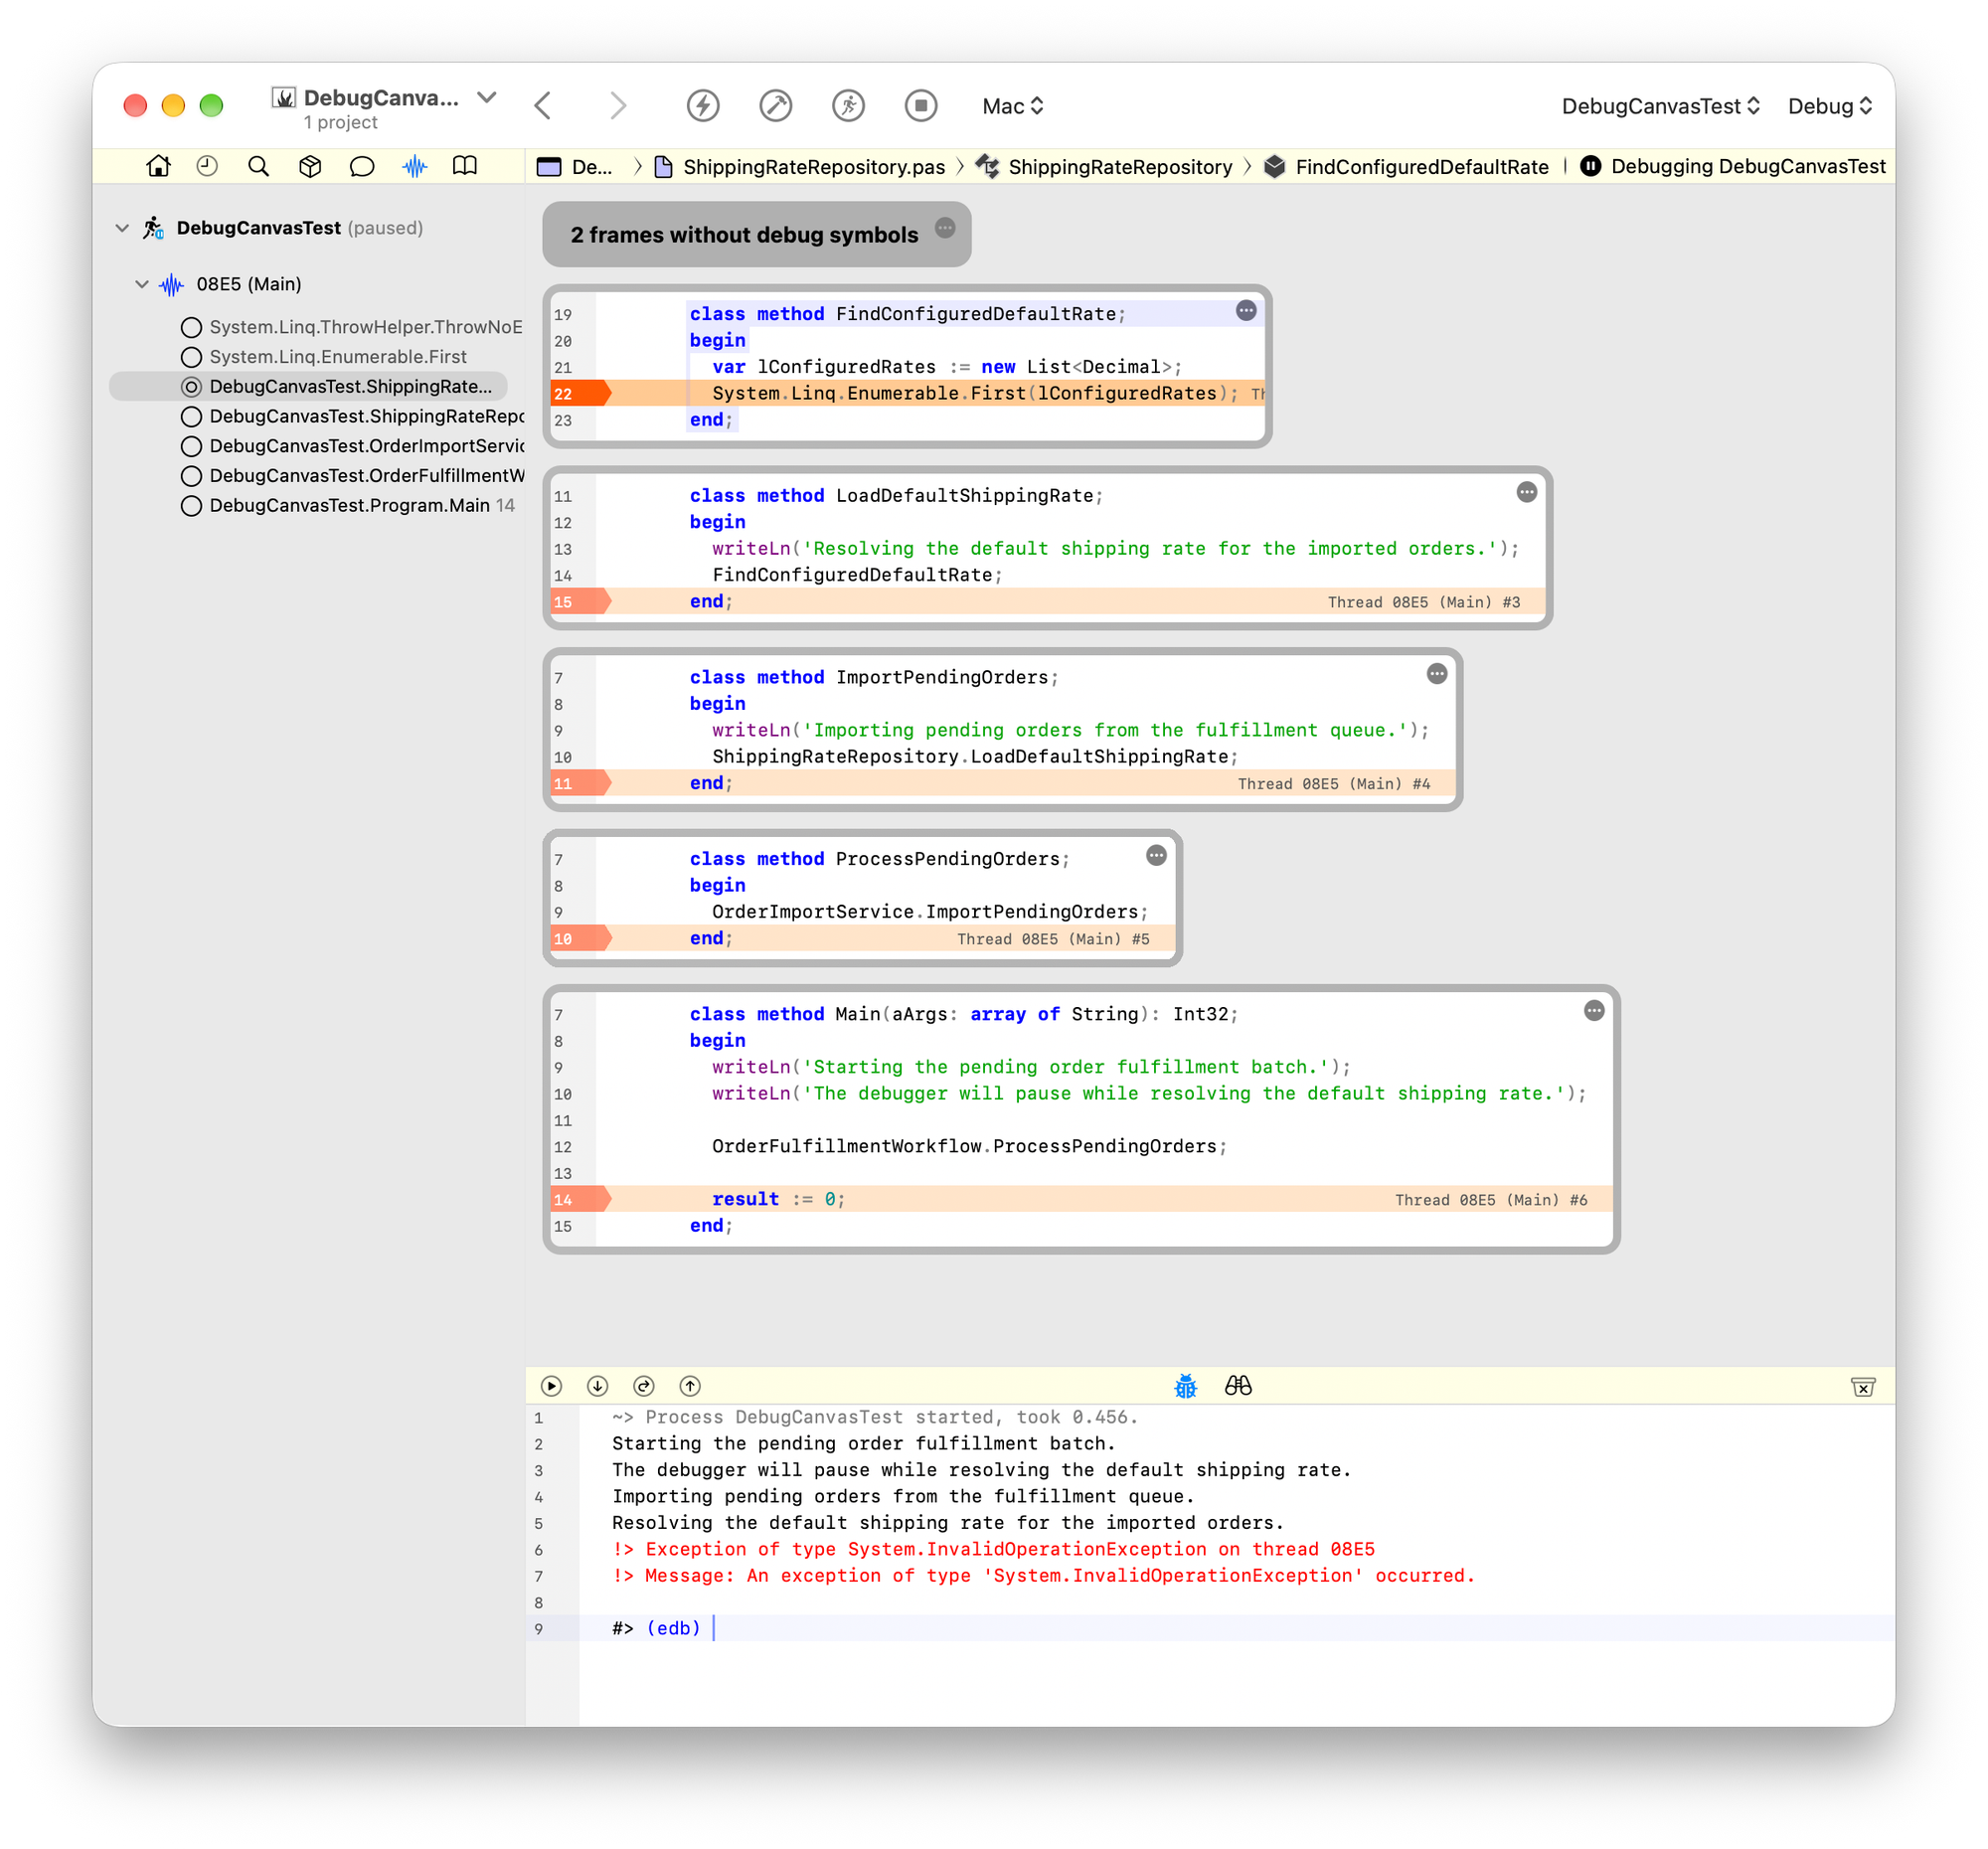
The Canvas is a new kind of view we added to the IDE that can combine snippets of code from various areas of your project in one view. In this case, it shows you code from every stack frame involved in your exception. You see thw whole path, all the way from Main() down to where the excepton is thrown.
This is not a read-only view; this is live source code. Just like in the "normal" code editor, you can navigate around, inspect values, and make changes to the code to address your bug.
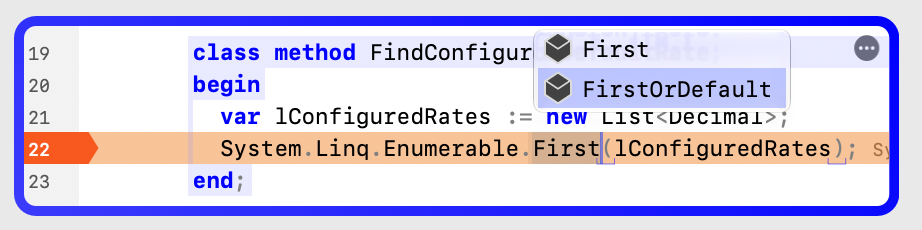
As you navigate between code snippets, the Stack Frames view on the left stays in sync, and vice versa.
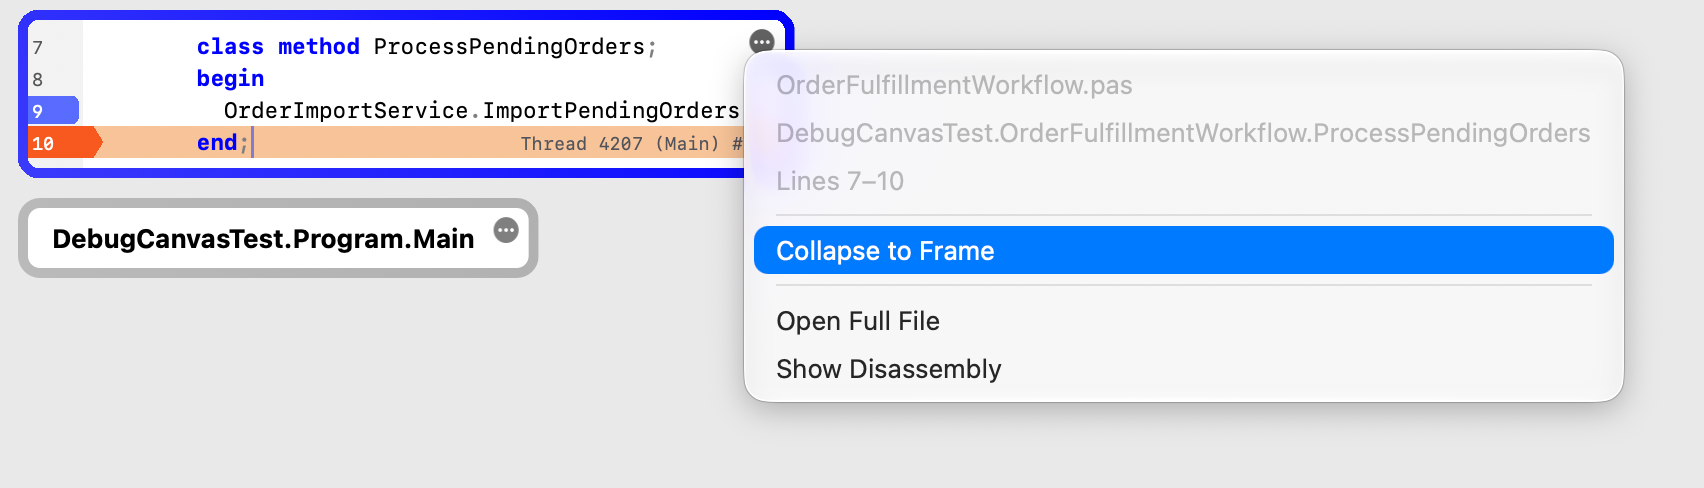
If the view gets too much, you can collapse irrelevant frames, or if you want to see the current frame in full context of its code, you can always navigate to the complete file view, like in the old days:
A super-handy feature, especially if you don't have the code for a method, such as the system's System.Linq.Enumerable.First is the "Show Disassembly" option:
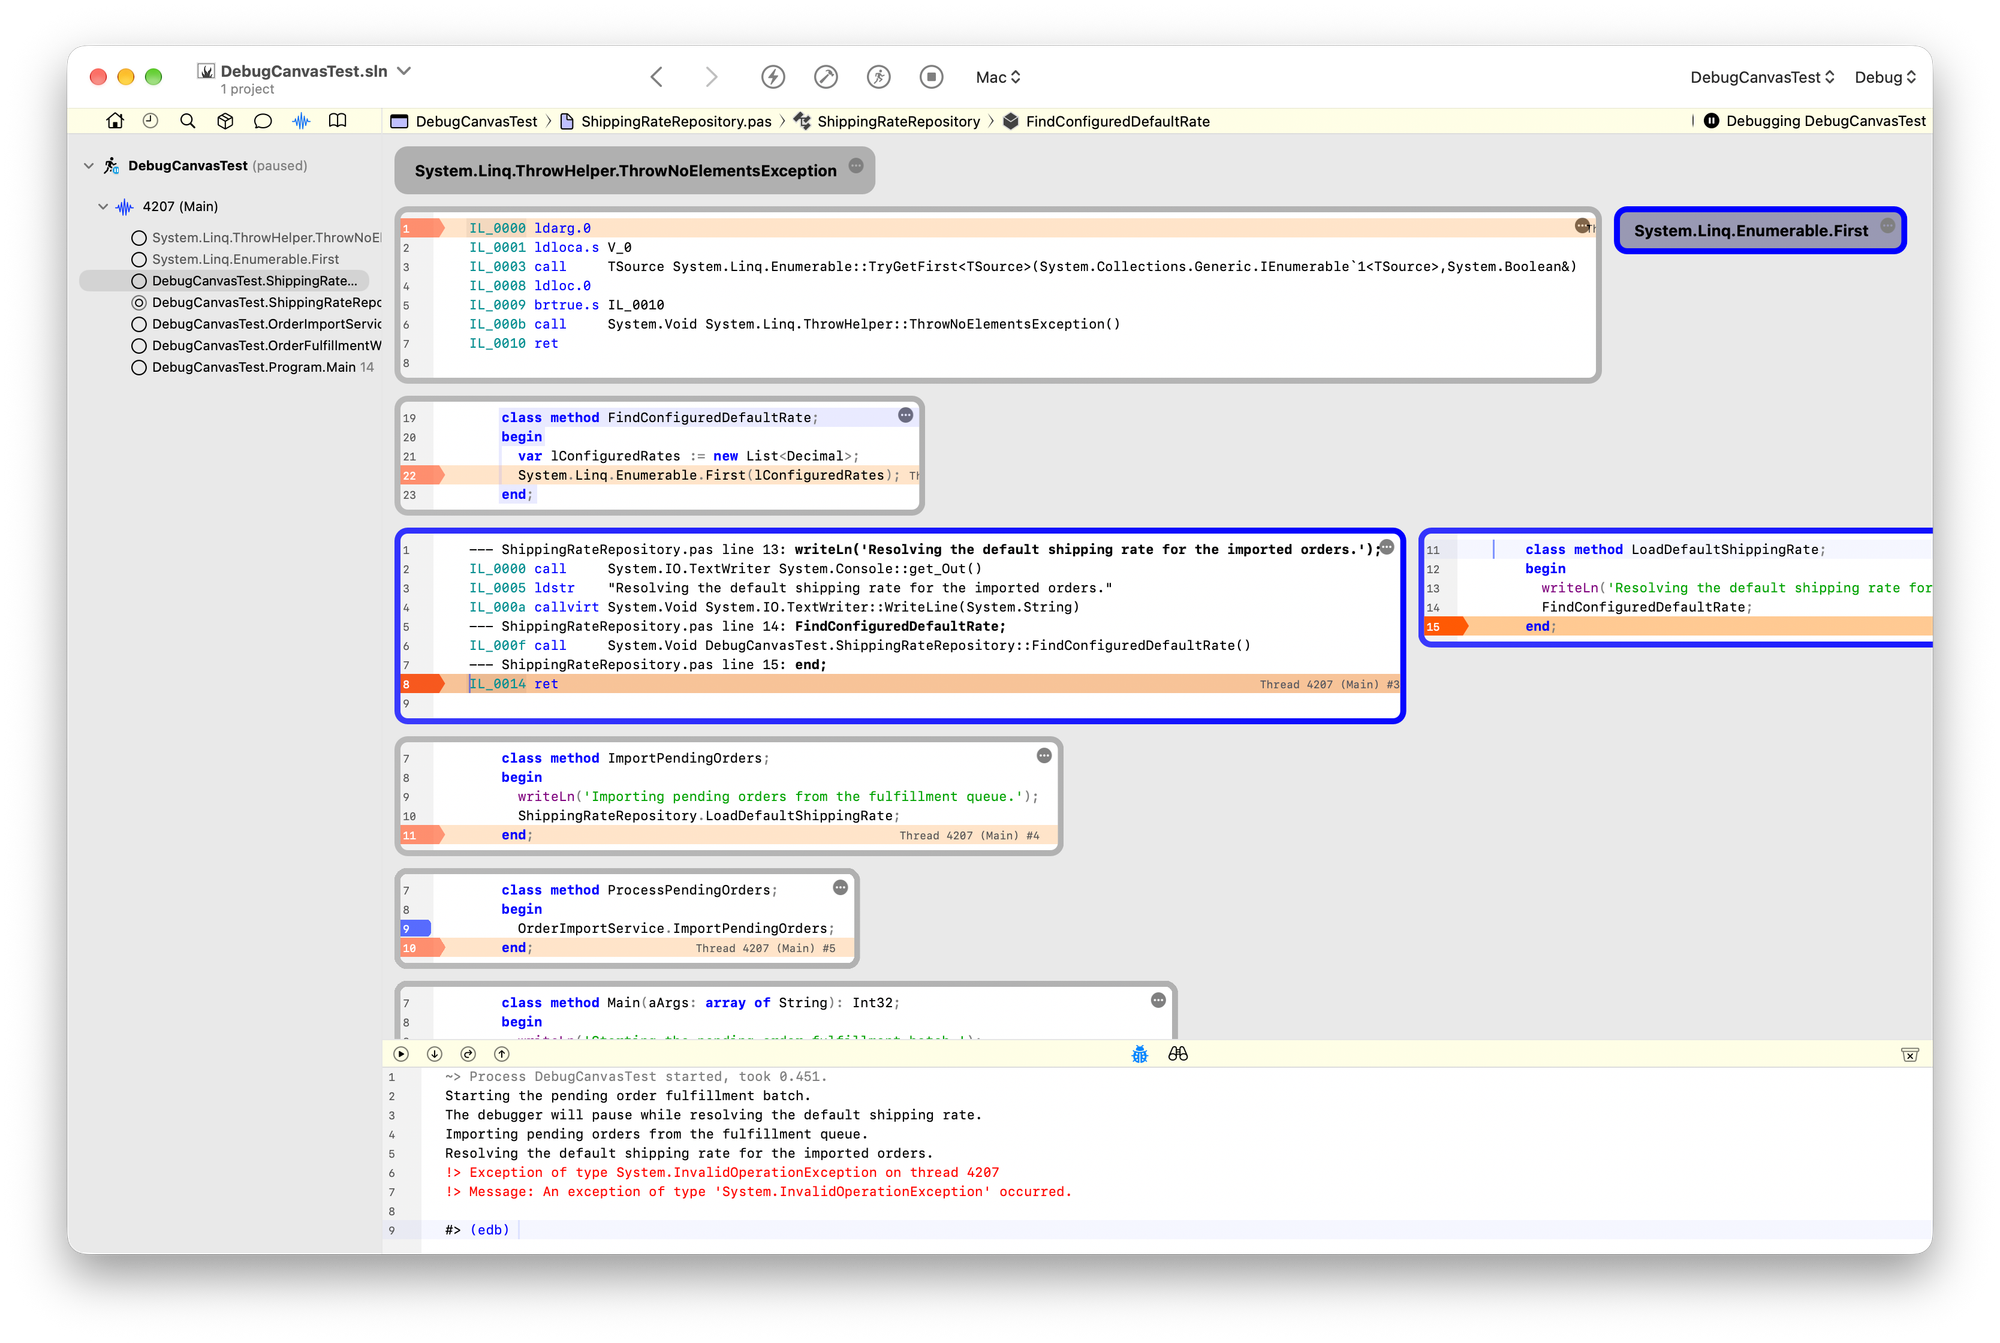
Disassembly has always been an option for CPU-native code on Toffee and Island, but it now also supported for .NET and will show you the intermediate language code for the frame. And Debug Canvas helpfully allows you to see IL and code (if available) side by side.
IL, still being fairly high-level, can give you a good understanding of a function you don't have the source for – without too much assembly knowledge needed.
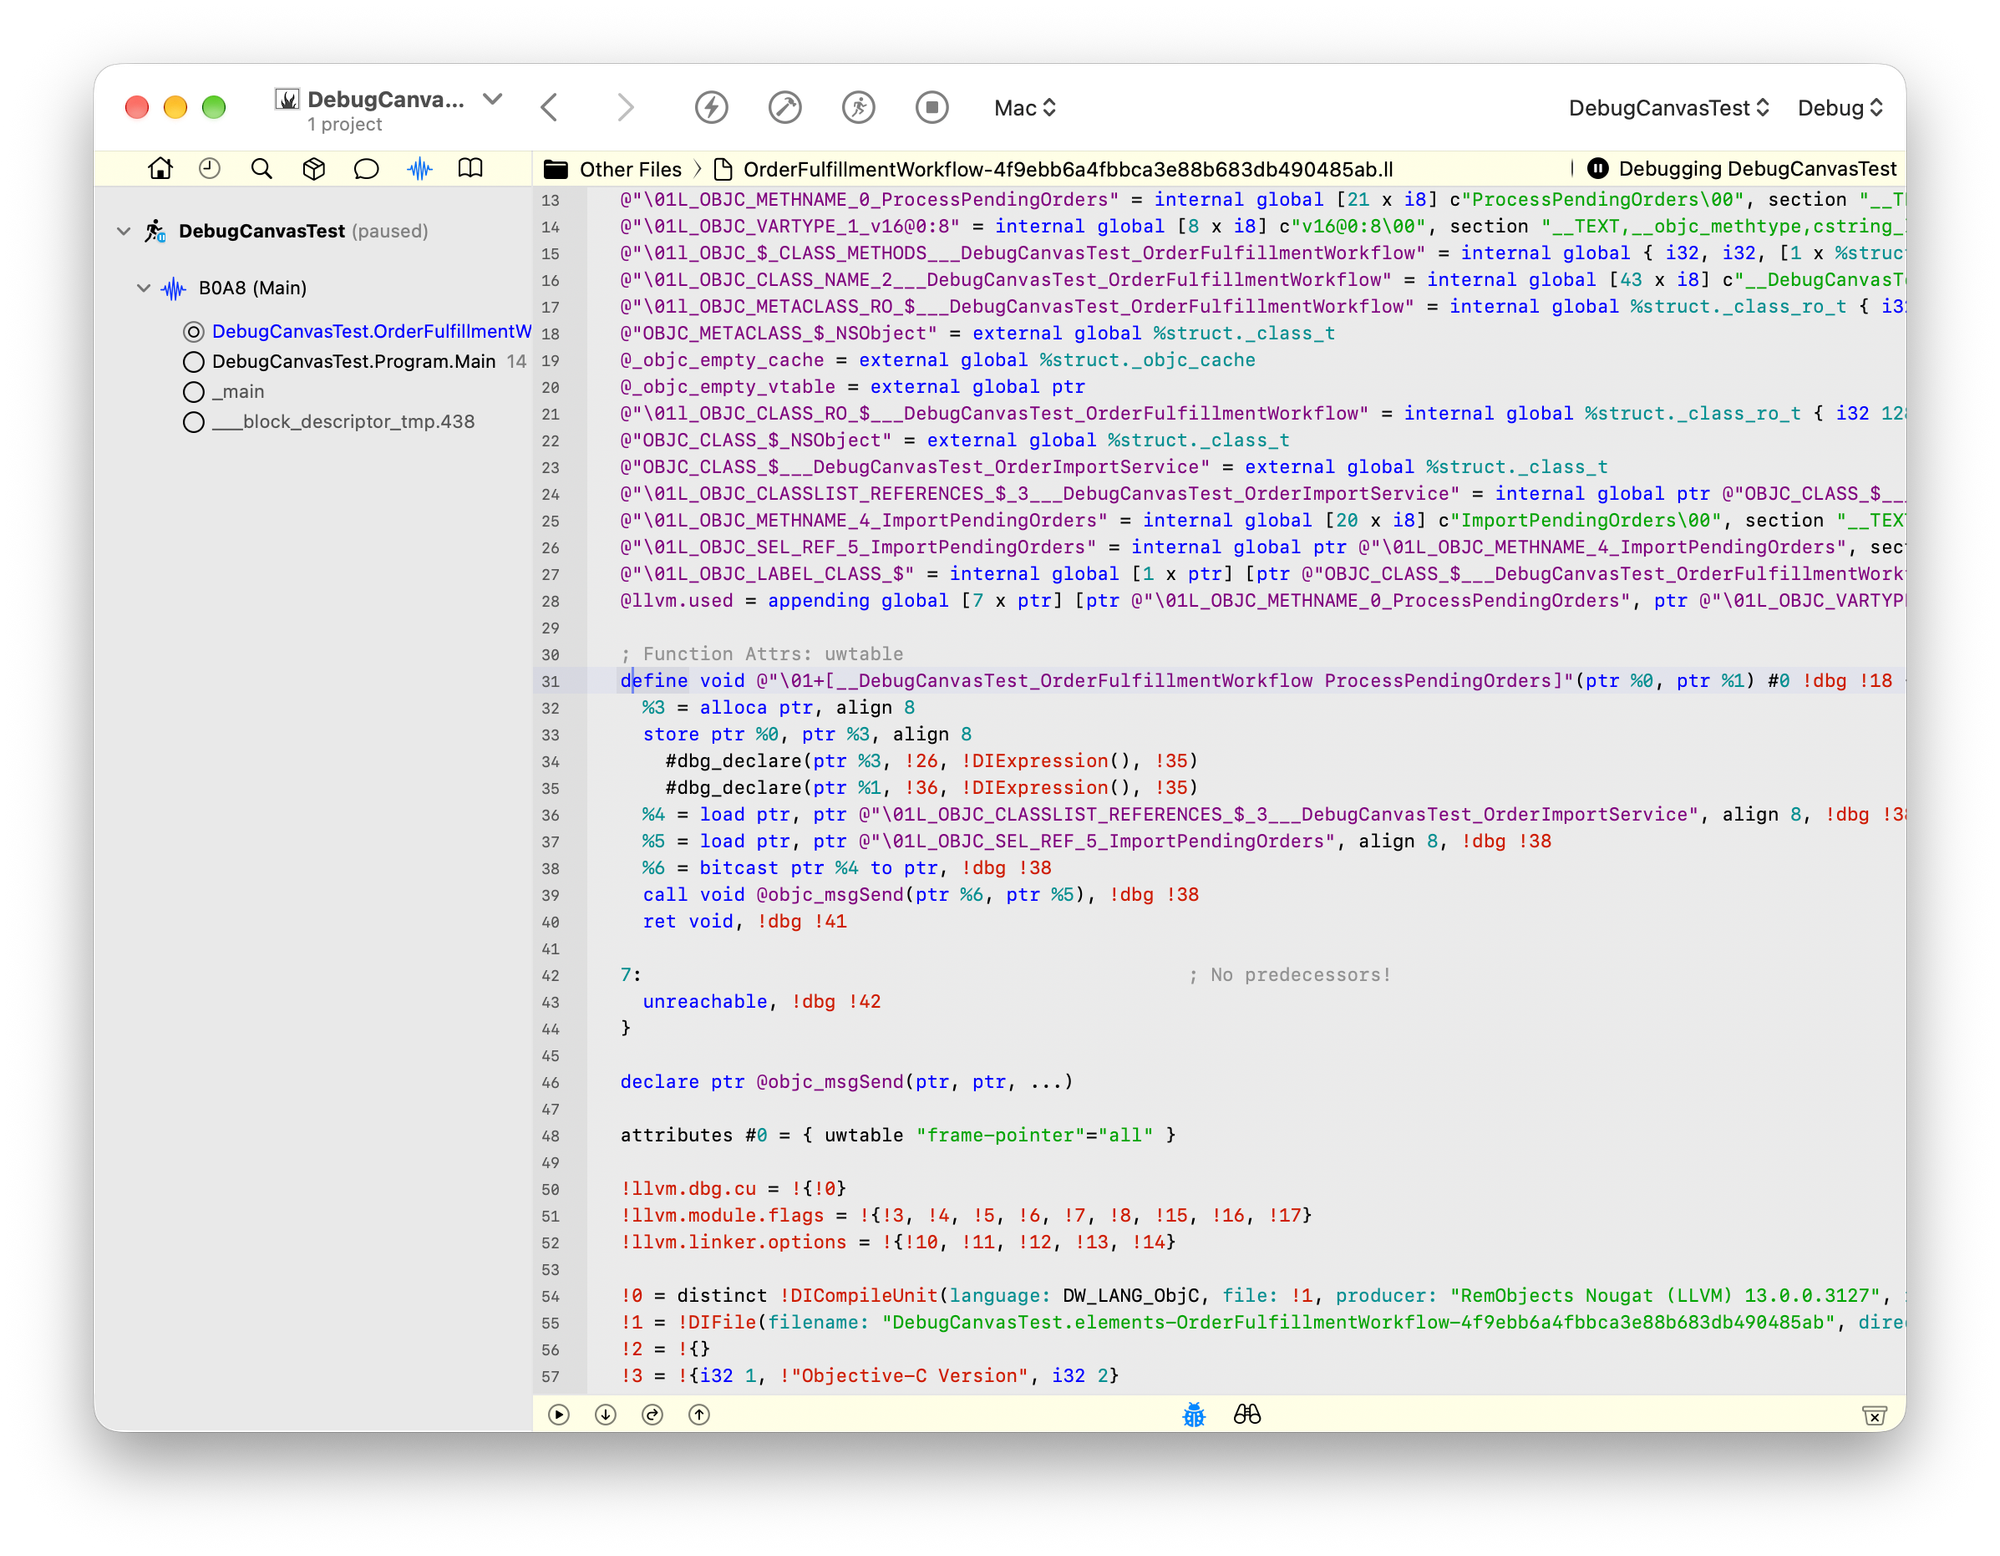
On the flip side, if you do want to get nerdy, for Toffee and Island projects, in addition to the raw CPU-level disassembly, you can now also ask to see the intermediate IR code that Elements generated for LLVM:
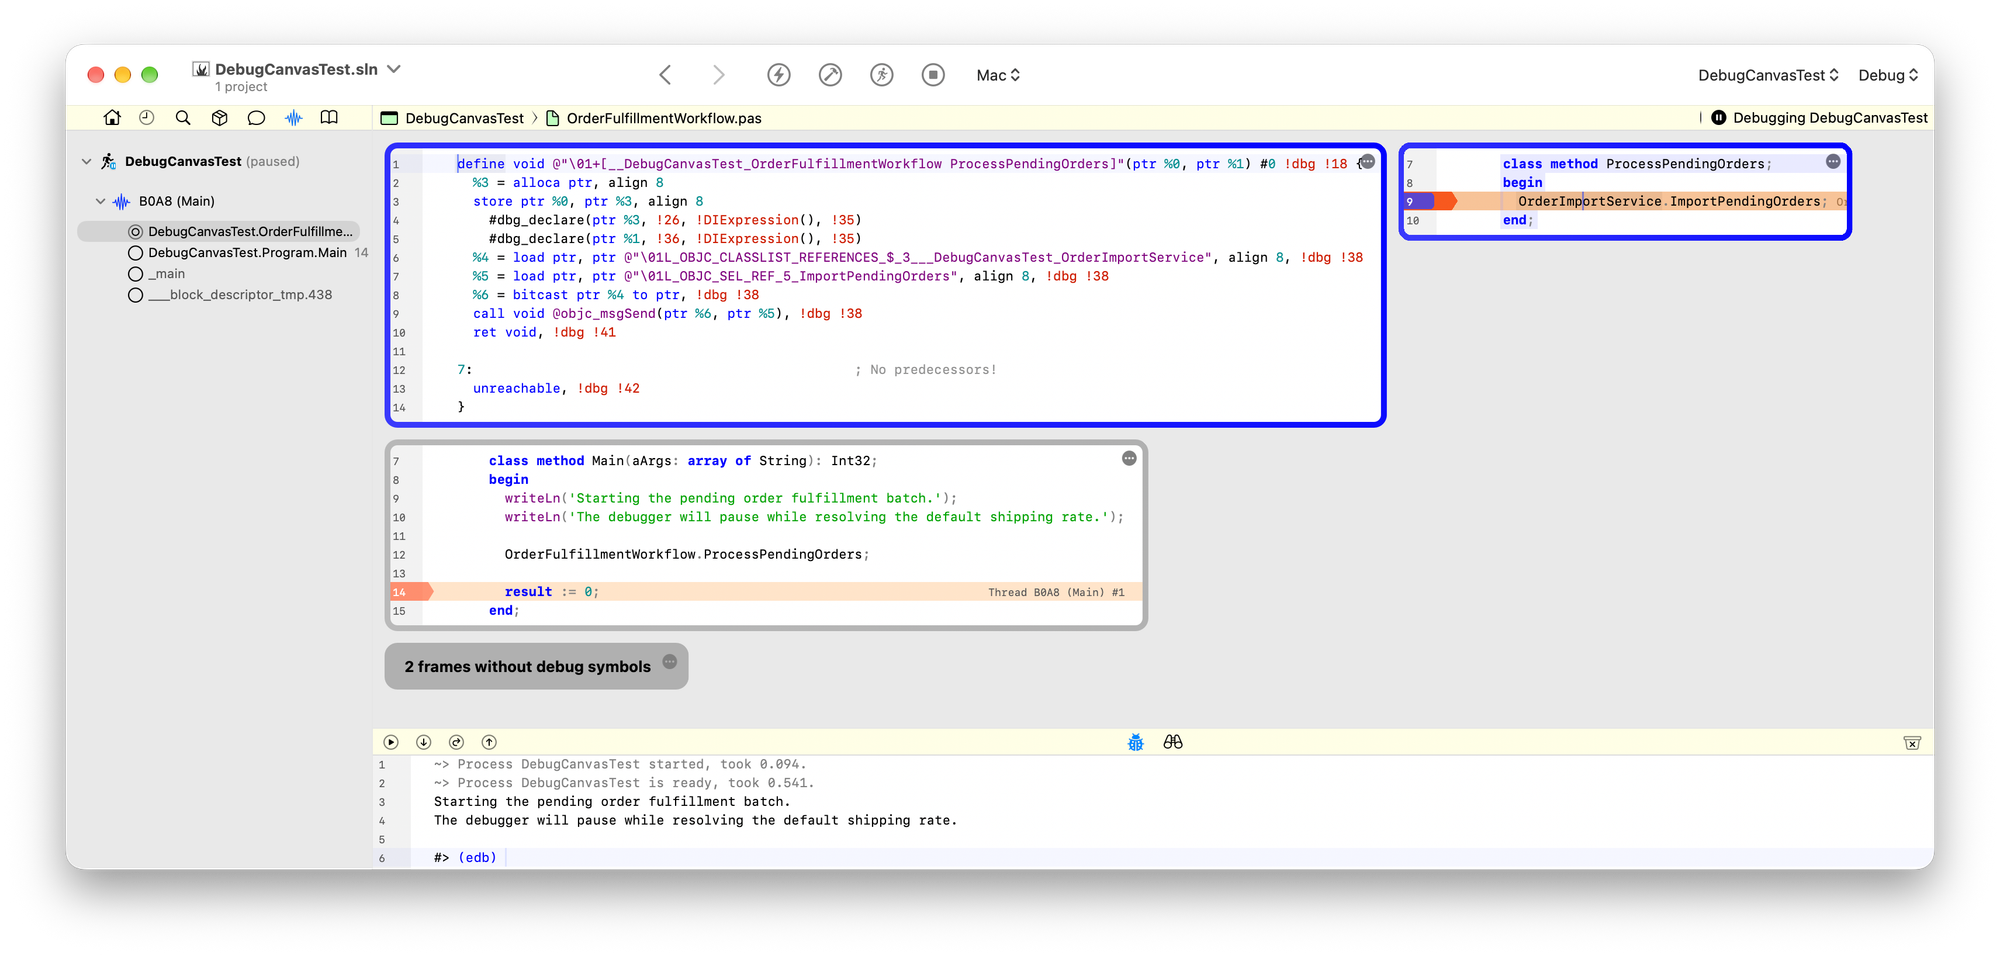
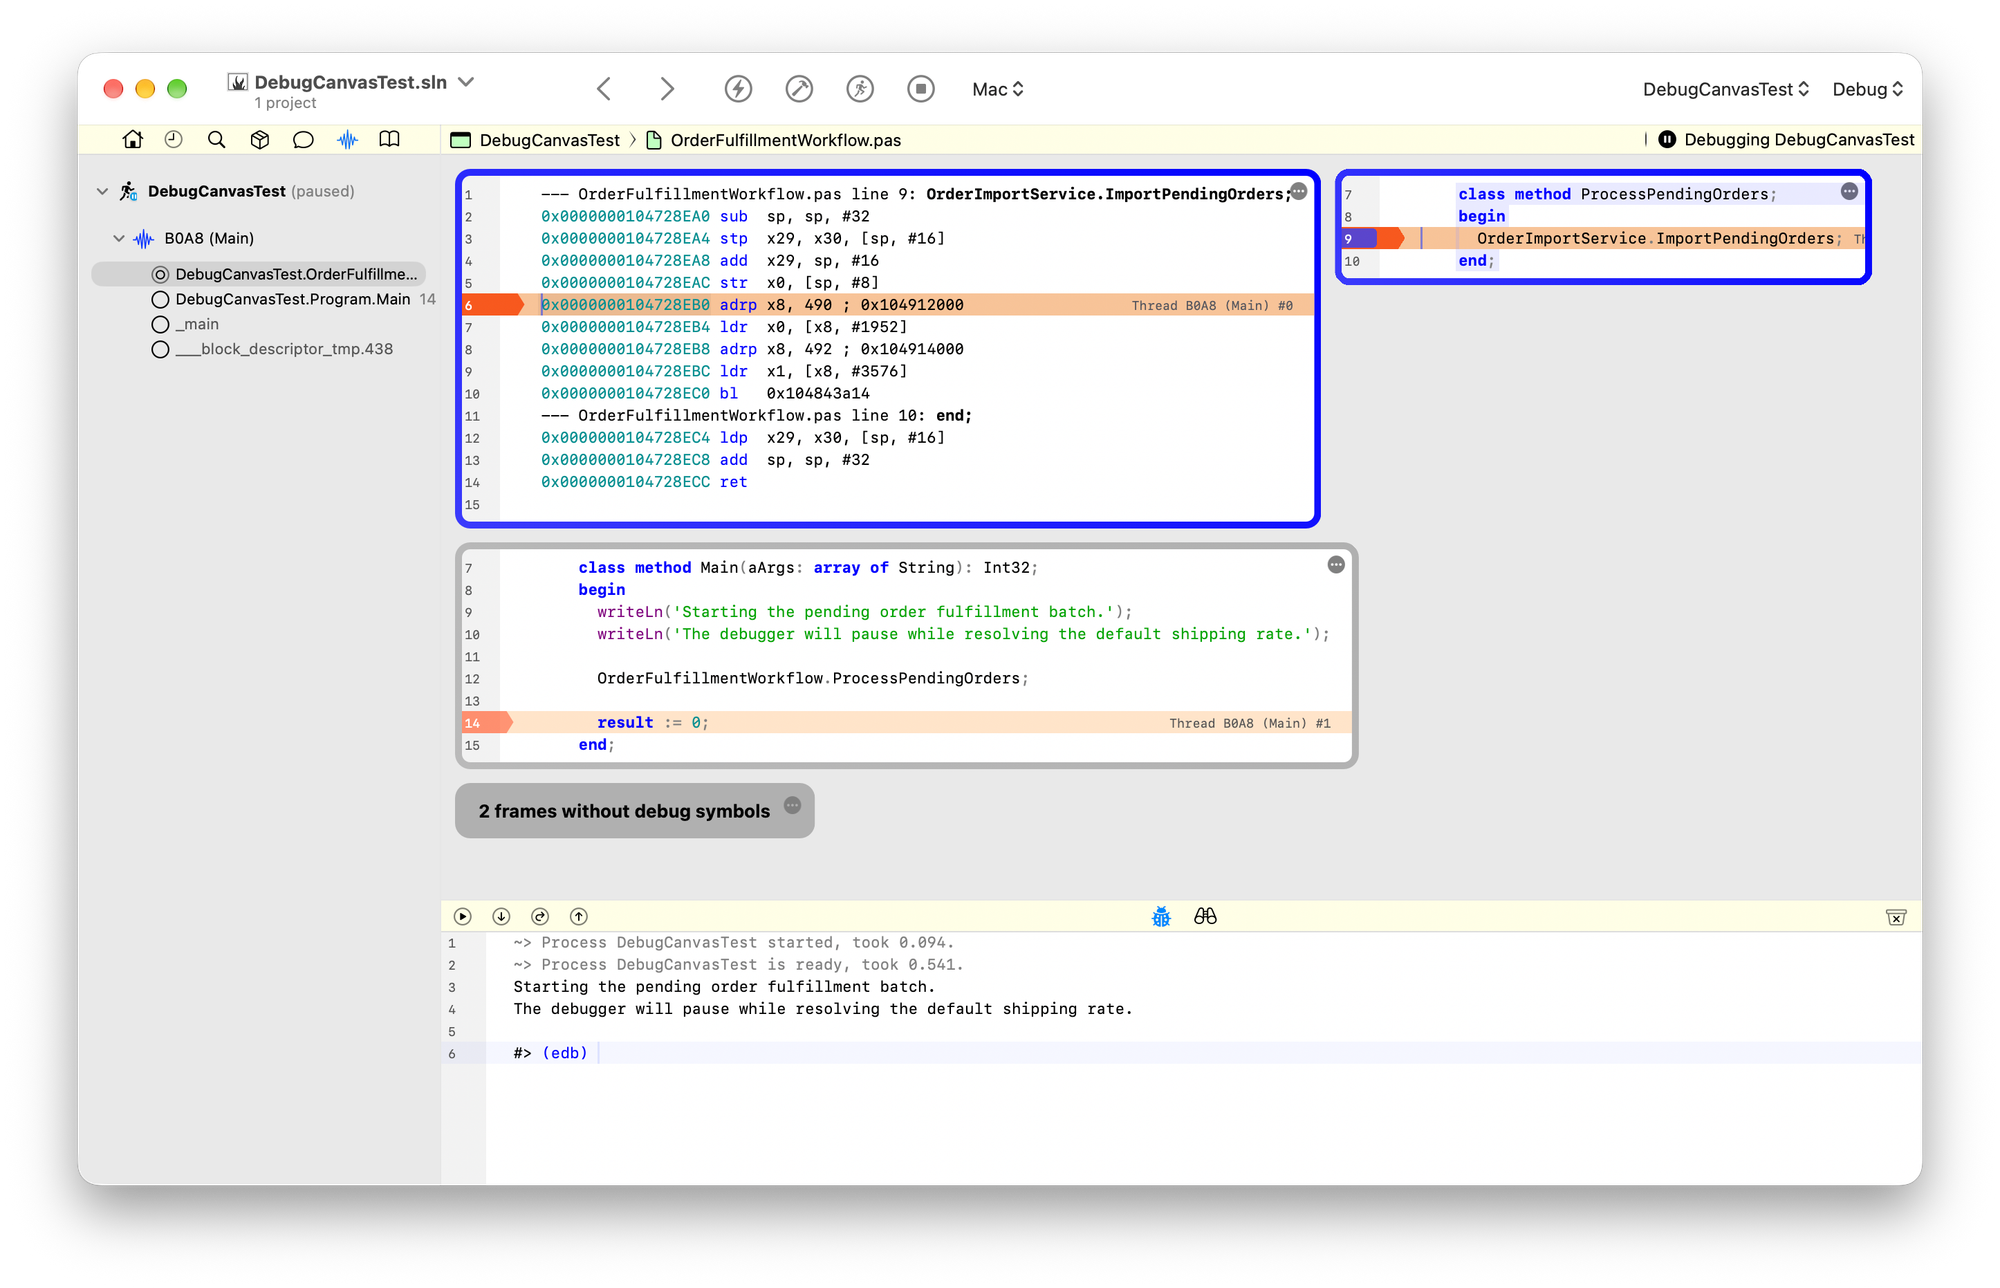
You can also see the full IR file, if needed:
Of course, if you prefer the classic UI on break, you can turn this option off in Settings.
More Canvases
Code Canvas is and will become available in more places, over time. For example, right now you can right-click inside a type member in any of your code files and choose "work with <x> in a Canvas" to create a new canvas with that member. You can then add more mempers top it, and if you use Go To Definition inside the canvas, the targets will be added there instead of navigating.
This allows you to build a dedicated workspace with code relevant to a current task, for example.
Let us know what you think!
Debug Canvas and manual canvases are available in the current Elements build, in Fire, Water, and Earth.
And coming up soon, a dedicated Canvas for CodeBot.
